
Produced water treatment technology selection survey
1 Dissemination method
The survey (Annex 1) was conducted using SurveyMonkey during the month of May 2018 using the LinkedIn networking platform to engage potential respondents. Respondents were sought via four routes:
- The Produced Water Group page (3,689 members)
- The GCC PW Group page (221 members)
- The Managing E&P Produced Water Group page (1,384 members)
- Personal post (>5,000 connections/followers)
These announcements generated ~14 responses over a period of seven days. Following this 55 individuals, either oil industry based or with direct experience in PW treatment, were contacted directly via LI messaging, with a follow-up message to those not responding within four days. This generated a further ~35 responses, along with ~4 more from the announcements.
The survey was then announced on two further LinkedIn groups:
- Oil and Gas People Group page (442,861 members)
- Oil and Gas People, Middle East Group page (82,794 members)
Further announcements were also made on the four original pages, generating another 14 responses. Finally, an announcement of the closure of the survey was made on all five group pages at the start of the final week. These actions generated a further 20 more responses in total. There were additionally three further respondents from email contact.
The survey was closed on midnight on Friday June 1st.
2 Data processing
The key two questions were identical, the difference between them being the manner of answering (rating for Q1 vs. ranking for Q2). Data were normalised to give the relative values of the rating and ranking, where:
relative value = 100% x (value – minimum)/(maximum – minimum)
The relative value thus provides a percentage where 100% is assigned to the most highly rated or ranked response and 0% to the least. This is more appropriate than the absolute values which, in the case of the rating data, lie within a relatively narrow range. For the ranking data from Q2 the “value” term in the numerator is given by “value = 6 – ranking”. The above equation then provides a relative value which increases with increasing ranking in the same manner as the relative rating value from Q1 (i.e., a high value is associated with increased importance).
Responses were processed by cohort (OEM/technology supplier, Oil company employee, Consultant, Contractor, and Academic). Some re-categorising of respondents who had placed themselves in the “Other” cohort was necessary (e.g. an ex-oil company employee was considered as a current employee for the purposes of the survey). This affected six responses in total. There were eight supplementary comments, with no pattern or consistency evident. Topics included water quality, regulation, subsidies, footprint, reuse and O&M.
3 Outcomes
There were 90 respondents to the survey, more than 80% being either technology suppliers, O&G company employees or consultants (Fig. 1). Only one responder could not be placed in an appropriate cohort. There were also eight skipped or incomplete responses to Q2; incomplete responses to this Question, i.e. responses failing to rank all six factors, had to be excluded due to the method of data processing.
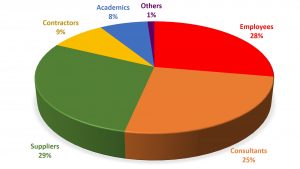
Figure 1: Respondent categories
The outcomes (Figs. 2-3) indicate a marked disparity in the two sets of response data, Q1 and Q2, and some variations between the cohort groups. The rating data (Fig. 2) indicate the risk of process failure and process flexibility to be the two most important considerations in selecting a PW technology across all cohorts, although the contractors and suppliers also rated waste generation very highly. Energy consumption and environmental impact were also consistently rated the least influential considerations across all cohorts other than the suppliers, for whom cost was rated marginally lower than environmental impact.
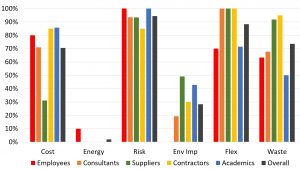
Figure 2: Rating data
Beyond this the patterns were less consistent across the different cohorts. Overall, cost was rated, on average, marginally below waste generation, but the rating from the suppliers was less than half that of the remaining cohorts. There was similar variability in the rating for waste generation, from 50% for the academics to 92% for the suppliers.
The ranking data (Fig. 3) confirm risk of process failure as being the primary consideration in selecting a PW treatment technology. However, for this quesion cost was the most highly ranked by all cohorts other than the employees, who ranked this factor around the same value as environmental impact – which was rated the lowest by this cohort in Q1. Also, process flexibility was ranked the second lowest by all cohorts other than the suppliers, who ranked it the highest. The disparity between the rating and ranking data was particularly evident for the consultant cohort, with the ranking scores for waste generation and process flexibility being considerably lower than the respective rating scores, and energy consumption conversely being scored much more highly in the ranking question.

Figure 3: Ranking data
4 Conclusions
Although the disparity between the two appraisal systems detracts from the survey outcomes to an extent, process failure risk was consistently perceived by most respondents as being the most important factor in selecting PW treatment technology (Table 1). This scored more highly than cost, despite process failure being quantifiable in cost terms, reflecting the perceived importance of process reliability. Since process flexibility relates closely to process failure risk it is unsurprising that this factor also rated highly in Question 1, although this did not translate to its calculated score for Question 2. By the same token, the low scoring of energy consumption for both questions is to be expected given that it is a component of both cost and environmental impact. However, the very significant change in the scoring of waste generation between rating and ranking cannot be readily explained.
Table 1: Summary of overall rating and ranking positions
| Position | Factor, rating | Score | Factor, ranking | Score |
| 1 | Risk of process failure | 94% | Risk of process failure | 96% |
| 2 | Process flexibility | 88% | Overall cost | 93% |
| 3 | Waste generation | 74% | Process flexibility | 50% |
| 4 | Overall cost | 71% | Environmental impact | 41% |
| 5 | Environmental impact | 28% | Energy consumption | 27% |
| 6 | Energy consumption | 2% | Waste generation | 4% |
Care must be taken in interpreting data from the relatively small sample within the Academic and Contractor cohorts (below 10 in both cases), where one or two outliers can skew the average. However, the number of respondents within the other three cohorts was between 25 and 29, sufficient to prevent this. As such, differences in the calculated scores between these cohorts may be taken as a reasonable reflection of their differing priorities or perceptions. Whilst process robustness is considered the most important factor across all cohorts, the importance assigned to factors such as cost and waste generation varies between cohorts. Finally, the construction of the question very clearly significantly impacts on the response.
Acknowledgment
This work was made possible by the support of a National Priorities Research Programme (NPRP) grant from the Qatar National Research Fund (QNRF), grant reference number NPRP10-0118-170191. The statements made herein are solely the responsibility of the authors.
Annex 1 The survey
Background
The Gas Processing Center at Qatar University is conducting a survey on the factors influencing produced water treatment technology selection. This forms part of a pilot-scale study of a PW treatment technology, conducted in collaboration with ConocoPhillips and funded under the National Priorities Research Programme of the Qatar National Research Fund (grant reference number NPRP10-0118-170191). The survey contains only three questions and should not take more than five minutes to complete (and, most likely, considerably less).
The outcomes will be disseminated via this Group. All submissions will be anonymous and will be deleted on completion of the survey in two weeks’ time (31 May) in compliance with data protection and privacy laws.
As a specialist in this area, your input would be much appreciated. Click on the link to start the survey.
Question 1
Assign a score (out of 10, 10 being the most influential) to each of the following six factors influencing PW treatment technology selection.
- Lowest lifecycle cost or NPV
- Highest energy efficiency (or lowest CO2 emissions) per volume water treated
- Lowest risk of process failure, i.e. incidents demanding unscheduled manual intervention or unexpected additional cost
- Lowest environmental impact, with reference to environmentally onerous discharges other than CO2
- Highest process flexibility (greatest ability to handle high variation in water quality and quantity)
- Highest water recovery/lowest waste volume generated
Question 2
Rank the six factors in the order they influence PW treatment technology selection, 1 being the most influential. Base your rankings on the caveats, conditions, qualifications or provisos identified in Question 1, if appropriate.
Caveats/qualifications to answer:
Question 3
Please indicate which of the following most applies to you
- OEM/technology supplier
- Oil company employee
- Consultant
- Contractor (M&E, Civils, etc)
- Academic
- Other (please specify)